Performance · Jun 2026
← Journal
PerformanceApr 2026 · 12 min read
ROAS Dropping? Run This 6-Step Diagnostic First (2026)
Before you nuke your campaigns, work through this checklist. 9 times out of 10 the answer is one of these six — and 8 times out of 10 it isn't the algorithm. The full diagnostic we run before touching a single ad set.
 PERFORMANCE
⏤ Summarize with AI
Open this article in your favourite chatbot for a 3-bullet summary.
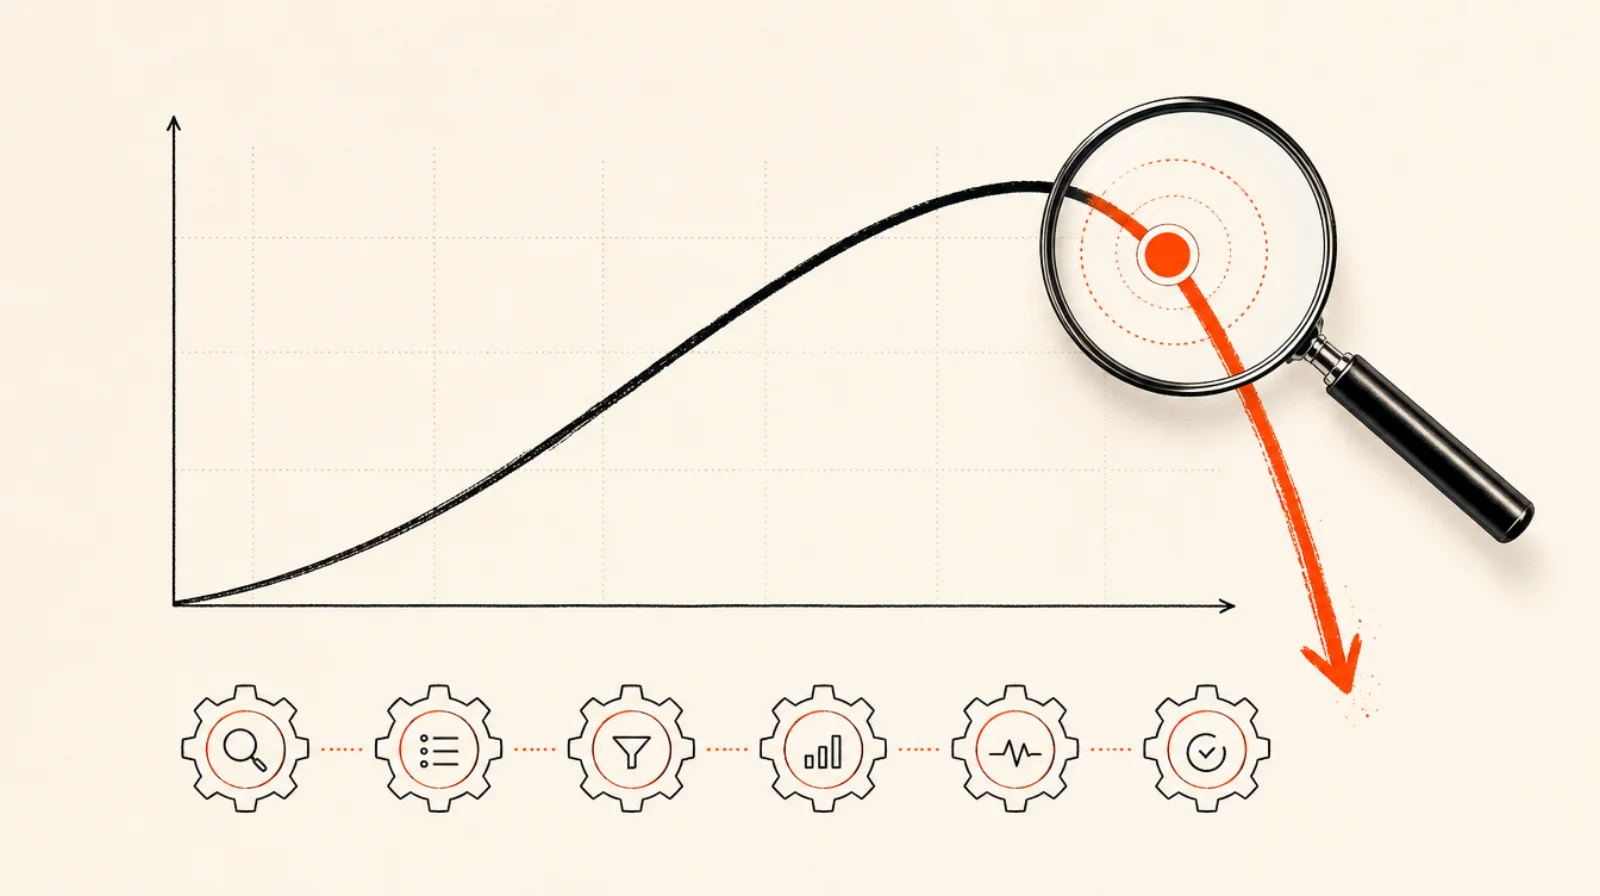
ROAS drops are the single most-asked Reddit question in performance marketing. The most common response is "rebuild the account" — and it's almost always wrong. A rebuild resets the algorithm's learning and costs you 2–3 weeks before you even know if it helped. Here's the 100-minute diagnostic we run first — and 9 times out of 10, it finds the real cause without touching the account structure.
When ROAS drops, don't restructure the account — run a 100-minute diagnostic first in this order: (1) is it actually performance or attribution drift, (2) creative fatigue (frequency above 2.5–3), (3) audience saturation and pixel/CAPI health, (4) AOV and discount cannibalisation, (5) site speed and PDP conversion drop, (6) category seasonality. 9 times out of 10 the cause is upstream of the ad account and a rebuild would have wasted 2–3 weeks.
Step 1 — is ROAS actually dropping, or is reporting?
Check three things before everything else: pixel firing correctly, Conversions API health, and the iOS share of unattributed purchases. A 20% ROAS drop on Meta + flat blended ROAS on Shopify means your attribution changed, not your performance.
The reconciliation that settles it: pull blended MER (total revenue ÷ total ad spend) for the period. If platform-reported ROAS fell but blended MER held, you have a measurement problem, not a performance problem — and restructuring the account would actively make things worse. Common triggers: a theme or app update that broke the pixel, a consent-mode change reducing trackable events, or iOS raising the unattributed share.
Step 2 — creative fatigue check
Sort active ads by frequency, descending. Anything > 2.5 is suspect. Anything > 3.5 is the cause. If 60%+ of your spend is going through high-frequency ads, you don't have a ROAS problem — you have a creative volume problem.
Cross-check with the funnel position where performance broke. If hook-rate (3-second video views ÷ impressions) fell while everything downstream held, the audience is tired of seeing the same opening frame — refresh the hook, not the offer. If hook-rate held but hold-rate and CTR fell, the body of the ad stopped landing. This is the most common real cause of a ROAS drop, and the fix is volume: ship fresh creative, don't rebuild the account.
Step 3 — has AOV moved?
ROAS = (Orders × AOV) / Spend. If AOV dropped 20%, your ROAS dropped 20% even if everything else was identical. Check:
- New SKU launched at a lower price point, dragging the average down?
- Discount code stacking, or a sitewide promo running?
- Free-shipping threshold lowered (smaller carts now clear it)?
- Bundle or upsell merchandising change on the PDP?
This is a 10-minute check that explains a surprising share of "ROAS drops." Pull AOV for the dip window vs the prior 30 days. If it moved, you've found a big chunk of the gap — and it has nothing to do with the ad account.
Step 4 — landing page speed and CVR
Your ad ROAS depends entirely on what happens after the click. If site CVR dropped 1 point, your ROAS dropped proportionally. Common causes:
- A new app installed on Shopify (review apps, popups, upsells) injecting render-blocking scripts.
- A theme update that broke a CSS or image lazy-load.
- Stock image swaps that aren't compressed, tanking LCP.
- An A/B test running with a leaky or broken control.
Quick check
Run a Lighthouse mobile audit on your top-3 PDPs. If LCP went from 1.4s to 2.6s last week, you found your ROAS bug — and it's not in the ad account. Every 0.5s of added load time on mobile measurably depresses conversion rate, and the ad account wears the blame.
Step 5 — audience saturation
If you've been spending the same amount in the same audience for months, you may have actually exhausted the cheap pocket. Signs:
- Frequency consistently > 3 across the account.
- Branded search volume flat (you're not converting non-brand into brand).
- New customer ratio dropping.
This is the rarest of the six causes — but it's also the one people most often blame. Run through the first four before you accept this one. If it's genuinely saturation, the fix is new prospecting audiences and top-of-funnel creative — not a restructure.
Step 6 — seasonality / category demand
Pull a Google Trends chart for your top non-brand queries vs. last year. Wellness CPMs in summer vs. winter look very different. Fragrance and gifting categories swing 30%+ MoM. If category demand dipped, your ROAS dipped — and rebuilding the account won't help. Compare year-over-year, not month-over-month, so you're separating a seasonal pattern from a genuine decline.

The order of operations
Run the checks in this order — cheapest and most-common causes first. Each card shows the rough time it takes.
1. Attribution / reporting check
15 min
Pixel + CAPI health, iOS unattributed share. Is ROAS dropping, or is reporting?
2. Creative fatigue check
15 min
Sort active ads by frequency. >2.5 is suspect, >3.5 is the cause.
3. AOV movement check
10 min
ROAS = (Orders × AOV) / Spend. A 20% AOV drop is a 20% ROAS drop.
4. Landing page speed + CVR
20 min
A 1-point CVR drop is a proportional ROAS drop. Lighthouse your top PDPs.
5. Audience saturation
30 min
Frequency >3 account-wide, flat branded search, falling new-customer ratio.
6. Seasonality / category demand
10 min
Google Trends your non-brand queries vs last year. Demand dips → ROAS dips.
- Attribution / reporting (15 min)
- Creative fatigue (15 min)
- AOV check (10 min)
- Site speed / CVR (20 min)
- Audience saturation (30 min)
- Category seasonality (10 min)
~100 minutes of diagnostic before you touch a single ad set. That is the 100 minutes that saves you a 3-week rebuild.
Frequently asked questions
Why is my ROAS suddenly dropping?
ROAS is a downstream metric, so a sudden drop is almost always caused by something upstream — and rarely by 'the algorithm.' The six most common causes, in order of how often they're the real culprit: (1) attribution/reporting changed (pixel, CAPI, iOS), so performance only looks worse; (2) creative fatigue — your top-spending ads are stale and frequency has climbed; (3) AOV moved because of a discount, a cheaper new SKU, or a shipping-threshold change; (4) site CVR dropped from a speed regression or a new app; (5) genuine audience saturation; (6) category seasonality. Work through them in that order before you touch the account structure.
Should I restructure my ad account when ROAS drops?
No — restructuring is almost always the wrong first move, and it resets the algorithm's learning, which makes things worse before they get better. A full rebuild costs you 2–3 weeks of learning-phase inefficiency. The diagnostic in this article takes about 100 minutes and resolves the actual cause 9 times out of 10 without touching the account structure. Diagnose first; restructure only if the diagnostic genuinely points to a structural problem (and it rarely does).
How do I know if it's creative fatigue or something else?
Sort your active ads by frequency, descending. Frequency above 2.5 is suspect; above 3.5 it's very likely the cause. Then check what share of spend is flowing through those high-frequency ads — if 60%+ of spend is on ads older than 14 days, you have a creative-volume problem, not a ROAS problem. The fix isn't restructuring; it's shipping fresh creative. If frequency is healthy (under 2.5) and ROAS still dropped, the cause is elsewhere — move to the attribution, AOV, and site-speed checks.
How long does it take for ROAS to recover?
Most ROAS drops resolve in 4–7 days once you fix the correct input — a creative refresh, an attribution fix, or a reverted site change. The slow recoveries are the ones where the brand misdiagnosed the cause, restructured the account, and entered a fresh learning phase: that adds 2–3 weeks of volatility on top of the original problem. The single biggest lever on recovery time is diagnosing correctly the first time.
Can an attribution change make ROAS look worse than it is?
Yes, constantly. If Meta-reported ROAS dropped 20% but your blended ROAS on Shopify is flat, your attribution changed — not your performance. Common triggers: a pixel or Conversions API misfire after a theme or app update, iOS privacy changes raising the unattributed share, or a consent-mode change reducing trackable events. Always reconcile platform-reported ROAS against blended MER (total revenue ÷ total spend) before you conclude performance actually fell.
Does AOV really affect ROAS that much?
Directly and proportionally. ROAS = (Orders × AOV) / Spend, so if average order value drops 20% — even with identical traffic, identical conversion rate, and identical spend — your ROAS drops 20%. The usual culprits: a new lower-priced SKU pulling the average down, discount-code stacking, a lowered free-shipping threshold, or a bundle-merchandising change on the product page. Check AOV before you blame the ad account; it's a 10-minute check that explains a surprising share of 'ROAS drops.'
How does site speed affect ROAS?
Your ad ROAS depends on what happens after the click. If landing-page conversion rate falls because the site got slower, ROAS falls proportionally even though the ads are performing identically. Run a Lighthouse mobile audit on your top 3 product pages — if LCP jumped from ~1.4s to ~2.6s in the last week, you've found your ROAS bug, and it's in the store, not the ad account. Common causes: a newly-installed Shopify app injecting render-blocking scripts, a theme update that broke lazy-loading, or uncompressed image swaps.
Is audience saturation a common cause of ROAS drops?
It's the cause people blame most and the cause that's actually responsible least. True saturation shows up as account-wide frequency consistently above 3, flat branded-search volume (you're not converting non-brand interest into brand demand), and a falling new-customer ratio. But it's the rarest of the six causes — run through attribution, creative fatigue, AOV, and site speed first. If you've cleared those four and the saturation signals are all present, then it's real, and the fix is new audiences and prospecting creative, not a rebuild.

How this fits the bigger picture
A ROAS drop is usually a creative or attribution symptom, not an account-structure one. If the diagnostic points to fatigue, our guide on creative fatigue and when to kill an ad is the next read. If it points to rising delivery costs, see why CPMs keep rising. And for the complete D2C performance picture — media, creative, attribution, scaling — start with our D2C marketing pillar guide. If you'd rather have the account diagnosed and run for you, that's our performance marketing service.
⏤ Free audit
Get a free audit in 5 working days.
Read-only access to your Meta + Google Ads accounts. Full teardown of wasted spend, creative fatigue, and ROAS forecast. No obligation.
⏤ Working on something similar?
Get a free audit in 5 working days.
Read-only access to your Meta + Google Ads accounts. Full teardown of wasted spend, creative fatigue, and ROAS forecast. No obligation. Or jump straight to our performance marketing page.