Performance · Jun 2026
← Journal
PerformanceMay 2026 · 16 min read
Meta Ads vs Google Ads for Indian D2C: Which Actually Works in 2026?
Most D2C founders treat Meta vs Google as a binary. The real answer is a budget split with structural differences in audience, attribution, and creative. Real CPM, ROAS, and CAC data from 62 Indian D2C brands — plus a budget allocation framework by stage.
 PERFORMANCE
⏤ Summarize with AI
Open this article in your favourite chatbot for a 3-bullet summary.
Most D2C founders ask "should I run Meta or Google?" as if it's a binary. It isn't. The two platforms do structurally different jobs — Meta creates demand, Google captures it — and the real question is the budget split at your stage. We manage paid media for 120+ active D2C brands across ₹38 Cr+ of annual spend, and the data is clear: the right ratio beats either pure-play by 35–45% on blended-MER. Here's the comparison, the real numbers, and a budget framework by stage.
The platform-binary trap
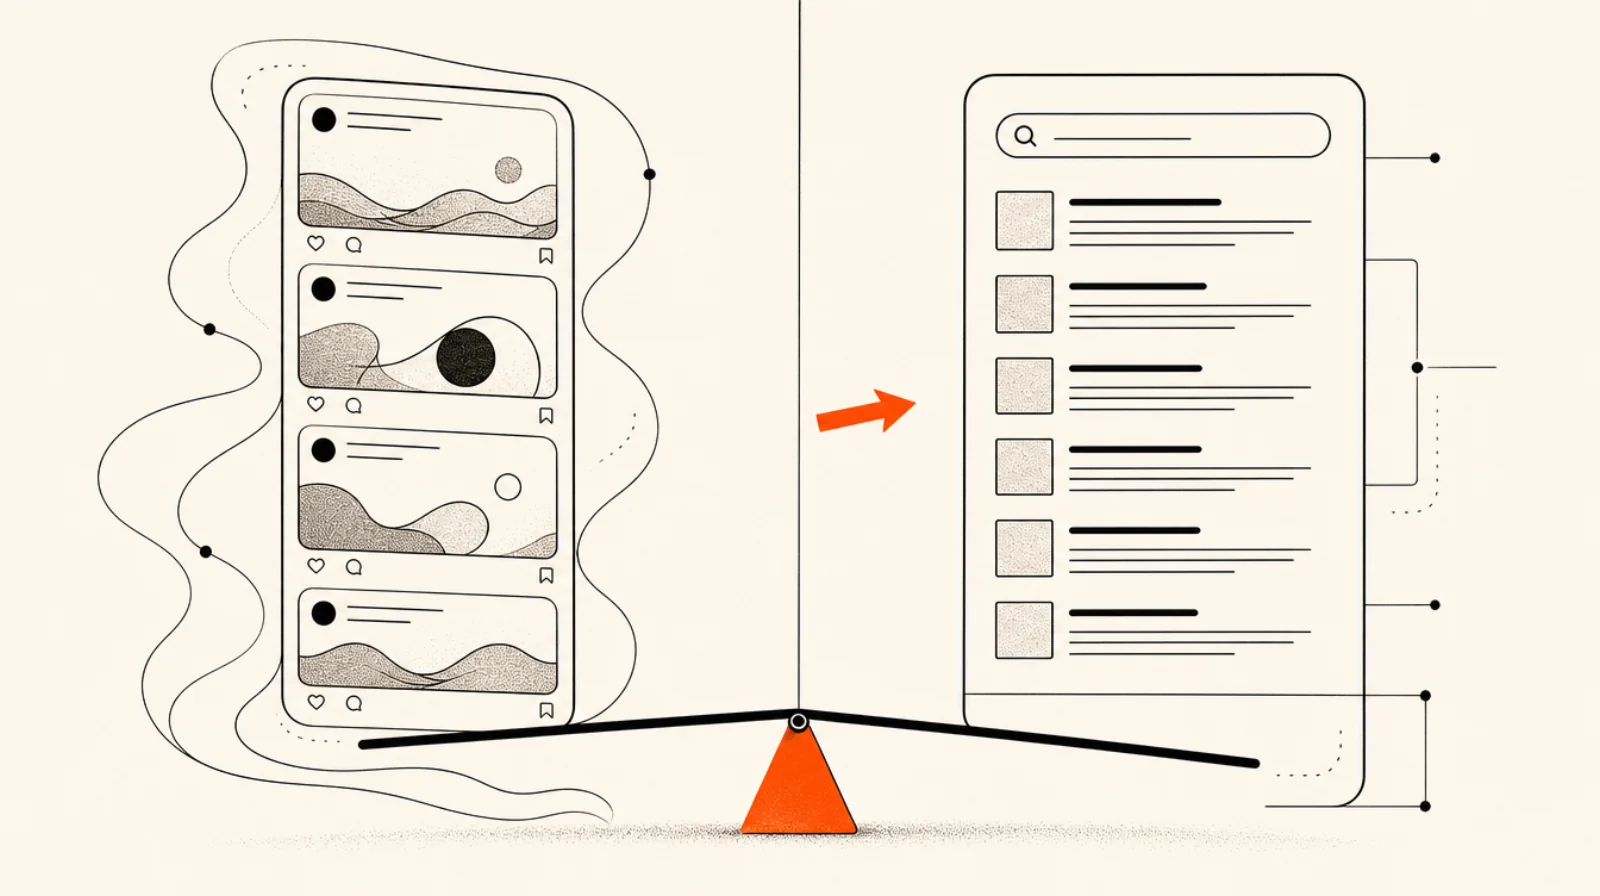
"Meta or Google?" is the wrong question — they work at different points in the buying journey. Meta creates demand (it interrupts people who aren't searching), Google captures it (it intercepts active intent). D2C brands need both halves of the loop; the only real question is the ratio.
The reason "Meta or Google?" is the wrong question: the two platforms operate at different points in the buying journey. Meta (Facebook + Instagram) is a demand-creation engine — people aren't searching for your product, they're scrolling, and your creative interrupts them. Google is a demand-capture engine — people are actively searching, and you intercept existing intent.
A brand running Meta-only creates demand it then fails to capture — someone sees your Instagram ad, googles your brand later, and a competitor's ad sits above your organic result and steals the sale. A brand running Google-only has nothing feeding the top of the funnel — it can only harvest demand that already exists, which caps its growth at the size of current search volume. You need both halves of the loop. The only real question is the ratio.
At a glance: the 5-dimension comparison
Across five dimensions — CPM, buyer intent, attribution clarity, creative cost, and scalability — Meta leads on demand-creation and visual discovery, while Google leads on high-intent capture and cleaner attribution. Neither wins outright; they do different jobs.
How the two platforms compare on the dimensions that matter for a D2C brand. Confidence ratings reflect how much we'd bet on each number — HIGH = portfolio data or public disclosure.
CPM range (₹)
- Meta
- ₹220–₹380
D2C fashion, our portfolio
- ₹40–₹220
Search low, Display/YouTube high
HIGH (portfolio + GroupM)
Min effective spend / month
- Meta
- ₹50,000
algorithm learning floor
- ₹30k Search / ₹1L PMax
Search cheaper to start
HIGH
India reach
- Meta
- ~490M FB + ~414M IG
Statista / DemandSage 2026
- Search ~750M, YouTube ~500M
widest reach in India
HIGH
Targeting model
- Meta
- Interest + lookalike + broad
creative-led optimisation
- Intent (Search) + in-market
captures existing demand
HIGH
Funnel position
- Meta
- Top + mid (discovery, retargeting)
creates demand
- Mid + bottom (intent capture)
harvests demand
HIGH
Attribution maturity
- Meta
- Pixel + CAPI + AEM
50–70% iOS gap
- GA4 + enhanced conversions
smaller iOS gap
HIGH
Typical D2C ROAS contribution
- Meta
- 2.5–4× (apparel/fashion)
blended
- 3.5–6× branded, 1.8–3.5× PMax cold
branded over-credited
MEDIUM (portfolio)
| Dimension | Meta (FB + IG) | Google (Search + PMax + YT) |
|---|---|---|
CPM range (₹) HIGH (portfolio + GroupM) | ₹220–₹380 D2C fashion, our portfolio | ₹40–₹220 Search low, Display/YouTube high |
Min effective spend / month HIGH | ₹50,000 algorithm learning floor | ₹30k Search / ₹1L PMax Search cheaper to start |
India reach HIGH | ~490M FB + ~414M IG Statista / DemandSage 2026 | Search ~750M, YouTube ~500M widest reach in India |
Targeting model HIGH | Interest + lookalike + broad creative-led optimisation | Intent (Search) + in-market captures existing demand |
Funnel position HIGH | Top + mid (discovery, retargeting) creates demand | Mid + bottom (intent capture) harvests demand |
Attribution maturity HIGH | Pixel + CAPI + AEM 50–70% iOS gap | GA4 + enhanced conversions smaller iOS gap |
Typical D2C ROAS contribution MEDIUM (portfolio) | 2.5–4× (apparel/fashion) blended | 3.5–6× branded, 1.8–3.5× PMax cold branded over-credited |
Methodology — how we built the numbers
The CPM, ROAS, and split figures come from Iblix's portfolio — 62 active D2C brands, ₹38 Cr+ in managed spend over 12 months, blended ROAS averaging 3.4× across the book. We cross-referenced the India-market CPM ranges against GroupM TYNY 2026, Madison Pitch 2026, and Dentsu's Digital Report. Reach figures are triangulated from DemandSage + Backlinko 2026 (Meta doesn't disclose country-level MAU). Attribution-gap data is from DOJO AI's 2026 iOS analysis.
Where Meta wins decisively for D2C
Meta wins for top-funnel discovery (reaching people who don't know your brand yet), visual-led categories (fashion, beauty, jewellery, home decor), fast and cheap creative iteration (30–50 concepts a month), and retargeting via dynamic product ads — its highest-ROAS play.
- Top-funnel discovery — reaching people who don't know your brand yet. Google can't create demand; Meta can.
- Visual-led categories — fashion, beauty, jewellery, home decor. Instagram's discovery behaviour is category-native.
- Fast creative iteration — Meta's UGC-first format + low creative cost means you can test 30–50 concepts/month cheaply.
- Retargeting — dynamic product ads to people who browsed but didn't buy. The highest-ROAS Meta play.
Where Google wins decisively for D2C
Google wins for branded-search protection (defending 8–12% of revenue from competitors bidding on your name), high-intent capture ("buy [product] online" converts 2–4× discovery traffic), Shopping / Performance Max on product feeds (4–6× ROAS with a strong catalog), and cleaner attribution under iOS signal loss.
- Branded search protection — defending 8–12% of revenue from competitors bidding on your brand name. Cheapest high-intent spend you have.
- High-intent capture — "buy [product] online" searches convert at 2–4× discovery traffic.
- Marketplace + Shopping — Performance Max on product feeds hits 4–6× ROAS for brands with strong catalogs.
- Cleaner attribution — GA4 + enhanced conversions suffer less iOS signal loss than Meta.
The budget split framework — by stage
There's no universal Meta/Google split — it shifts by spend stage. At ₹2L–₹10L/month the safe default is roughly 65% Meta / 30% Google / 5% other; as spend, branded search, and marketplace presence grow, the ratio tilts toward Google. Always optimise on blended-MER, not per-platform ROAS.
The split that maximises blended-MER, by spend stage:
| Stage | Monthly spend | Meta | Other | Why | |
|---|---|---|---|---|---|
| Pre-PMF | < ₹50k | 100% | 0% | 0% | Meta finds PMF fastest via creative iteration |
| Early scale | ₹50k–₹2L | 80% | 20% | 0% | Add Google Search for branded protection |
| Sweet spot | ₹2L–₹10L | 65% | 30% | 5% | Full stack: PMax + Search + Display alongside Meta |
| Scale phase | ₹10L–₹50L | 55% | 30% | 15% | Add JioStar CTV + marketplace ads |
| Enterprise | ₹50L+ | 50% | 35% | 15% | Full omnichannel incl. OTT + influencer + retail media |
"Other" at scale means JioStar CTV (see our JioHotstar D2C playbook), marketplace ads, and influencer. The exact ratio flexes by category — visual-led brands skew more Meta, considered-purchase and high-search-volume brands skew more Google.
The 7-question framework: how to decide YOUR split
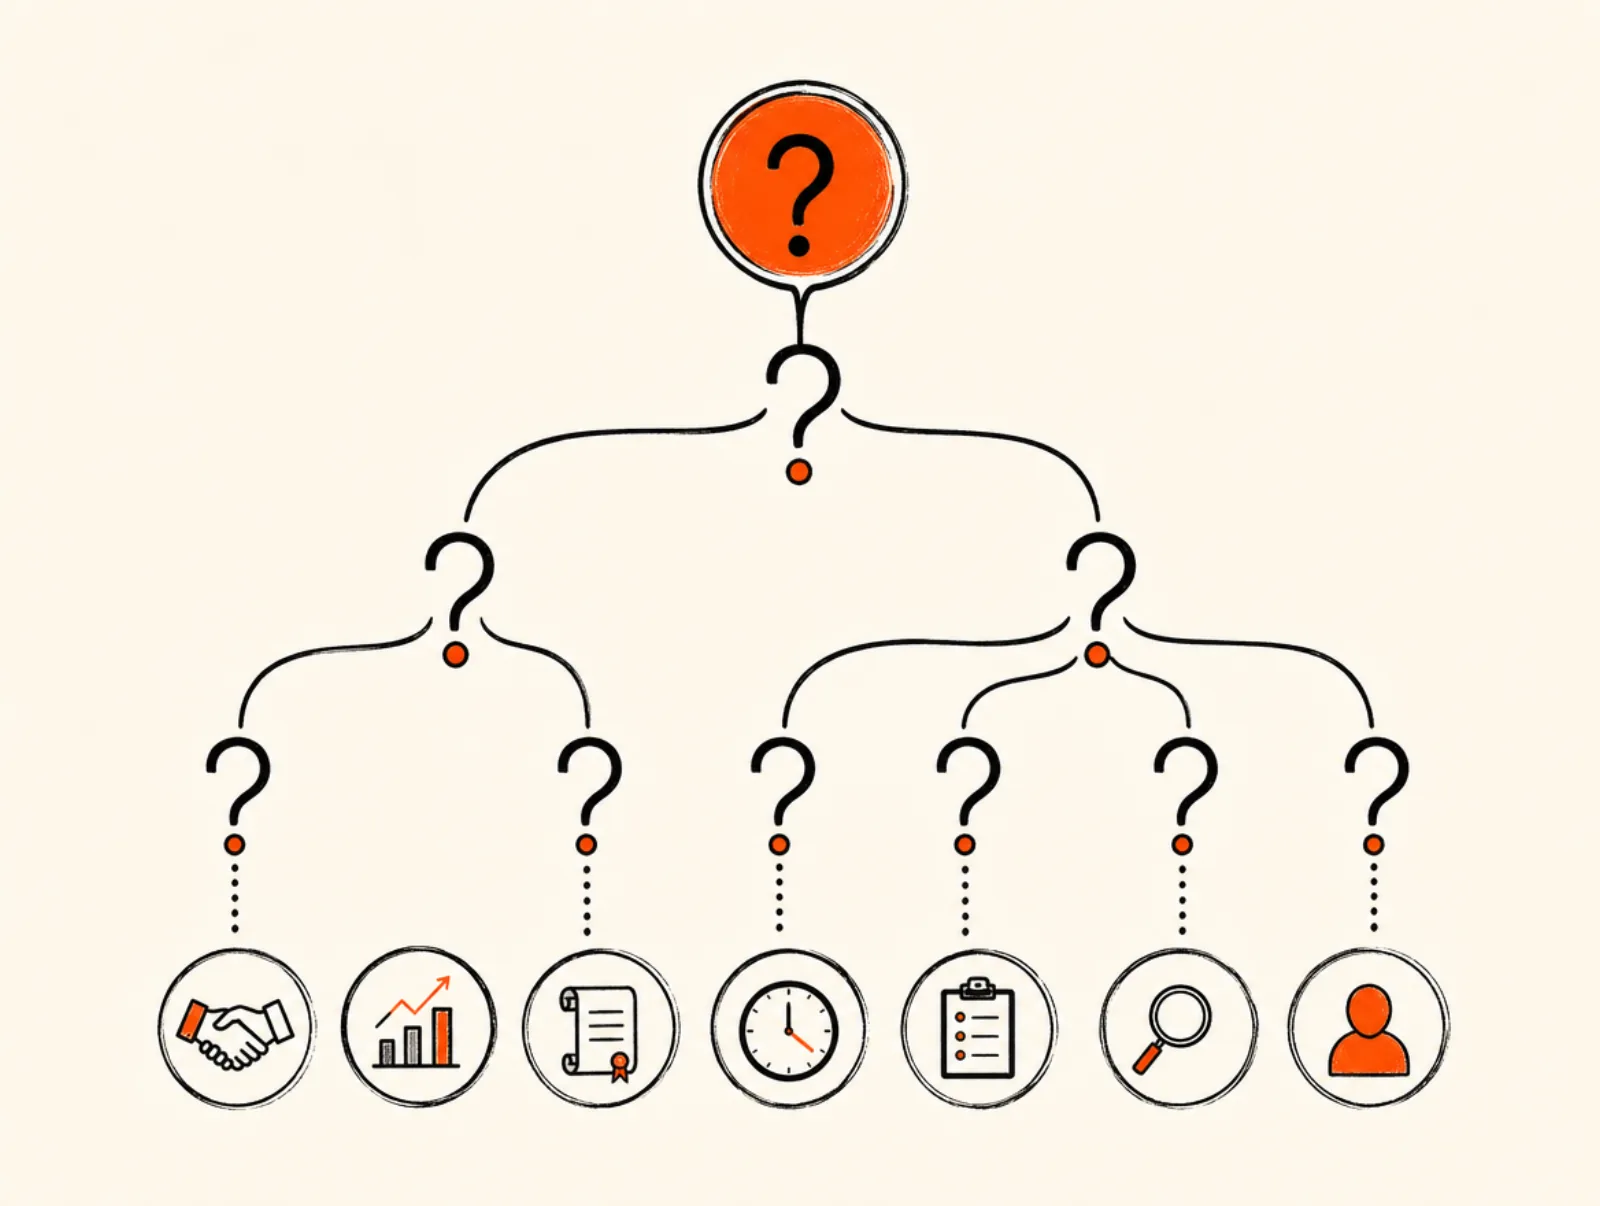
Decide your split with seven questions — on spend level, category (visual vs considered-purchase), branded-search volume, marketplace presence, attribution maturity, creative capacity, and stage. More spend + more branded search pushes the ratio toward Google; early-stage + visual category keeps it Meta-heavy.
1. What's your monthly ad spend? (Below ₹50k → Meta only.)
2. Is your category visual-discovery-led (fashion/beauty) or intent-capture-led (considered purchases)?
3. Do you already have branded search volume above ~500/month? (If yes, Google branded protection is critical.)
4. Is your creative pipeline set up for Meta's UGC cadence (30–50/month)?
5. What's your iOS traffic share? (Above 40% → Meta attribution gap matters more.)
6. Do you sell on marketplaces (Amazon/Flipkart/Myntra)? (Google PMax for retail can hit 4–6×.)
7. What's your blended-MER vs in-platform-ROAS gap right now?
Run these honestly. The pattern: more spend + more branded search + more marketplace presence pushes the ratio toward Google. Less spend + visual category + early stage keeps it Meta-heavy. When in doubt at ₹2L–₹10L/month, the 65/30/5 default is the safest starting point — then let blended-MER data move it.
FAQ
Meta ads vs Google ads — which is better for Indian D2C brands in 2026?
Neither, in isolation — the right answer is a budget split. Meta wins for top-funnel discovery and visual-led categories (fashion, beauty); Google wins for intent capture, branded-search protection, and marketplace-adjacent demand. Across our 120+ brand portfolio the typical split is 65% Meta / 30% Google / 5% other, and that split outperforms either pure-play by 35–45% on blended-MER over six months. Below ₹50k/month spend, run 100% Meta. The platform binary is the wrong frame — the question is the ratio at your stage.
What's the typical Meta vs Google budget split for D2C brands?
By stage: Pre-PMF (under ₹50k/month) → 100% Meta. Early scale (₹50k–₹2L) → 80/20 Meta/Google. Sweet spot (₹2L–₹10L) → 65/30/5 Meta/Google/other. Scale phase (₹10L–₹50L) → 55/30/15 with JioStar + marketplace added. Enterprise (₹50L+) → 50/35/15 full omnichannel. The pattern: Meta dominates early because it finds product-market fit fastest; Google's share grows as branded search volume and marketplace presence build.
How much does it cost to run Meta ads in India?
CPMs for Indian D2C fashion run ₹220–₹380 (our portfolio), with the blended portfolio average around ₹290 — up 22% YoY. The minimum effective monthly spend is ₹50,000: below that, Meta's algorithm can't gather enough conversions to escape the learning phase. Creative production is a separate cost: ₹5,000–₹50,000 per UGC asset, and you need 30–50 fresh creatives/month at scale to keep CPMs stable.
How much does it cost to run Google ads in India?
Google CPMs are lower than Meta for D2C — ₹40–₹150 for Search, ₹80–₹220 for Display/YouTube. But the cost model differs: Search is CPC-based (₹8–₹60/click depending on category and keyword competition). Minimum effective spend: ₹30,000/month for Search-only, ₹1,00,000/month for Performance Max (which needs more data volume to optimise). Branded search protection costs ₹15–₹40 CPC but defends 8–12% of organic-driven revenue from competitor capture.
Should D2C brands run Performance Max or stick with Search + Display?
Performance Max (PMax) works well above ₹1L/month spend and especially for brands with strong product feeds and marketplace presence — it can deliver 4–6× ROAS on retail inventory. Below ₹1L/month, PMax doesn't have enough data to optimise and you're better with manual Search + Display where you control placements. The risk with PMax: it over-credits branded search (claiming conversions that would've happened anyway), so always run it alongside a branded-search exclusion or you'll overstate its true incremental ROAS.
Why is my Meta ROAS dropping in 2026?
Three usual causes, in order of likelihood: (1) creative fatigue — you're not shipping enough fresh creative (need 30–50/month), so the algorithm runs the same ads to the same people and CPMs rise; (2) iOS attribution loss — 50–70% of iOS conversions aren't reported in-platform, so your real ROAS is higher than Meta shows; (3) audience saturation — you've exhausted your best audiences and need to expand. The fix is almost never 'rebuild the account.' See our ROAS-dropping diagnostic for the full 6-step check.
Should I run branded search on Google if my brand is small?
Yes, once you have even ~300–500 branded searches/month. Competitors bid on your brand name; without branded-search defence, you lose 8–12% of customers who searched for you specifically to a competitor's ad sitting above your organic listing. Branded clicks are cheap (₹15–₹40) and convert at 2–4× your non-branded rate because the person already wants you. It's the highest-ROI Google spend a growing D2C brand has.
What's the difference between Meta CAPI and Google enhanced conversions?
Both are server-side conversion-tracking methods that recover data lost to iOS/cookie restrictions. Meta's Conversions API (CAPI) sends conversion events server-to-server, bypassing browser-level signal loss — essential for accurate Meta attribution post-iOS-14. Google's enhanced conversions does the same for Google Ads, hashing first-party data (email/phone) to match conversions. Both are now mandatory for accurate measurement in 2026 — pixel-only / tag-only tracking is broken. Set up both.
Can D2C brands skip Google ads and only run Meta?
Below ₹2L/month spend, yes — 100% Meta is defensible while you find product-market fit. But brands that stay Meta-only as they scale hit a wall around month 3–4: they're not capturing the branded + high-intent demand that Meta's discovery creates, so a competitor harvests it on Google instead. The 65/30 split outperforms Meta-only by 35–45% on blended-MER once you're above ₹2L/month. Meta creates demand; Google captures it — you want both halves of that loop.
How long does it take to see Google ads results vs Meta?
Google Search shows results fastest — you're capturing existing intent, so conversions can start day one. Performance Max needs 2–4 weeks to exit learning. Meta needs 7–14 days for the algorithm to find your audience, then compounds as your creative library grows. Net: Google Search is the fastest to first conversion, Meta is the faster to scale once it's learned. Neither is 'instant' at meaningful volume — budget 30 days before judging either.
Which platform has better attribution for Shopify D2C brands?
Google has the cleaner attribution in 2026 — GA4 + enhanced conversions + Google's first-party data graph suffer less from iOS signal loss than Meta does. Meta's attribution gap runs 50–70% on iOS-heavy D2C traffic, meaning your real Meta ROAS is materially higher than the platform reports. The practical fix for both: stop trusting in-platform ROAS, set up CAPI + enhanced conversions, and judge everything on blended-MER sourced from Shopify revenue. The truth is in your Shopify numbers, not either ad platform's dashboard.

How this fits the bigger picture
Your Meta/Google split is one decision in the full D2C marketing stack. For the complete picture see our D2C marketing pillar guide. If your Meta ROAS is the thing dropping, run the 6-step ROAS diagnostic first. And the reason Meta CPMs keep climbing — and why creative volume is the fix — is in our CPM breakdown.
⏤ Free audit
Get a free audit in 5 working days.
Read-only access to your Meta + Google Ads accounts. Full teardown of wasted spend, creative fatigue, and ROAS forecast. No obligation.
⏤ Working on something similar?
Get a free audit in 5 working days.
Read-only access to your Meta + Google Ads accounts. Full teardown of wasted spend, creative fatigue, and ROAS forecast. No obligation. Or jump straight to our performance marketing page.